inchworms -
Fri 23 August, 2013, 15:30
Carla: “Do you know what’s really hard?”</br>
Anja: “No.”</br>
Carla: “What’s really hard is how hard it is to keep thinking so hard all the time.”</br>
With a screen that looked like this most of the day no wonder our brains were hurting.
Anja eventually worked out a solution to one of our problemos, earning herself a special Grumpy Carla forehead sticker. (Grumpy Carla © Bioshrimp 2013)
And a BIG thanks to our amazing coach Matt. He’s not only a champ with Sinatra, he also knows his way around d3. We are impressed!


inchworms -
Thu 22 August, 2013, 17:00
There are more than just a programming issue when you want to draw a map with d3. It took literally half a day to find a working Berlin map.
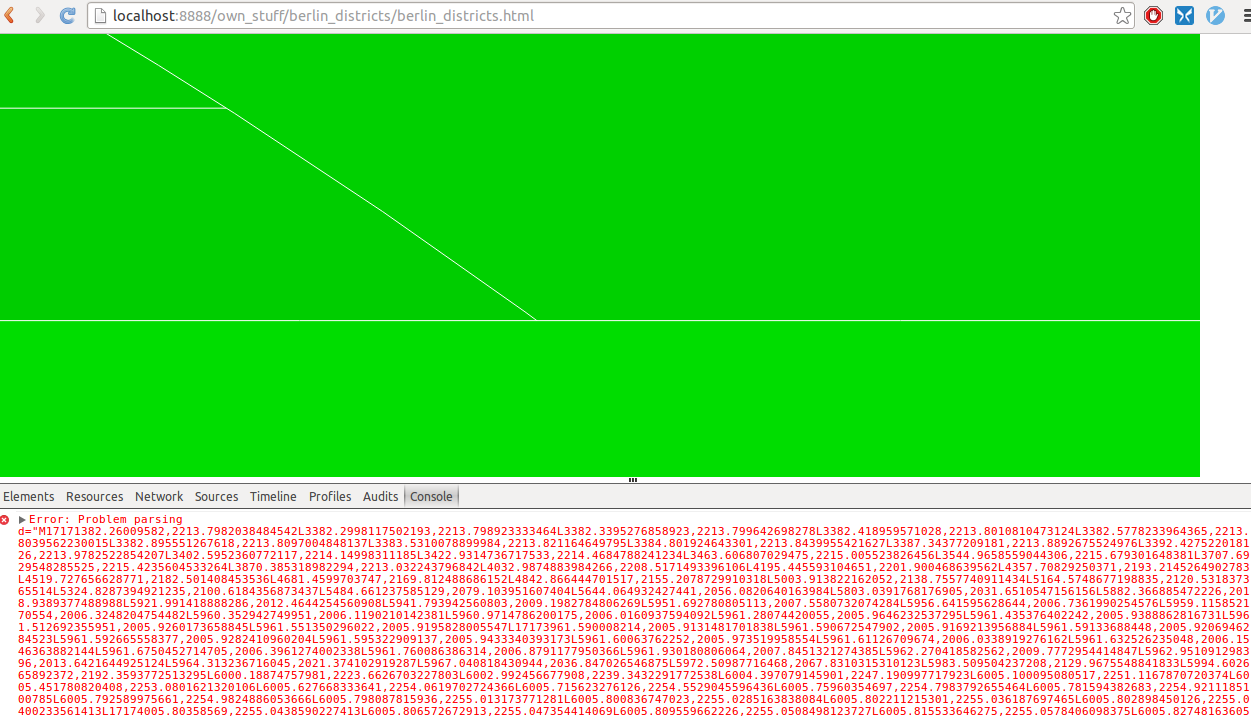 Not working json
Then I came across that github account with a perfectly working map with the districs already in geojson format. Just what I was looking for.
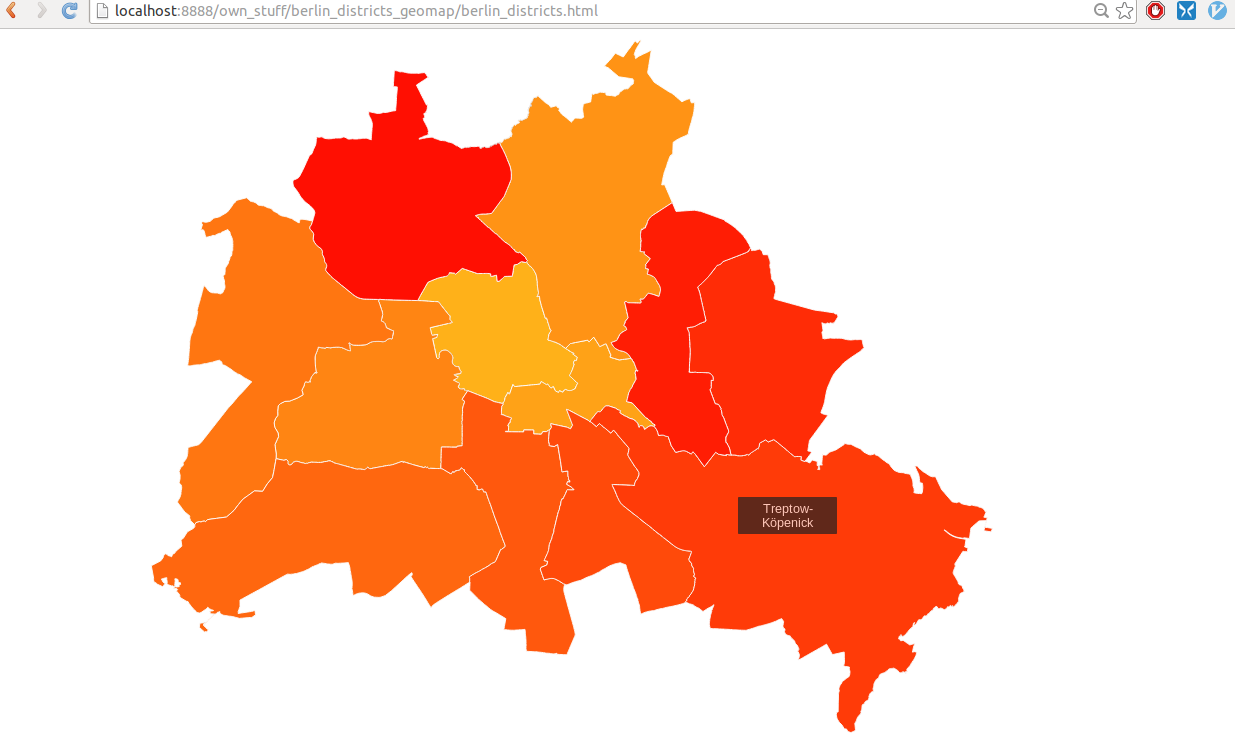 working json
Isn’t it gorgeous? And look at the colors!
Anyway then I made a choropleth map out of it and finally (took me half a day and a movie-evening with friend(there were complaing I wasn’t watching)) got bars that are transforming from the BOTTOM to the top like normal bars do and not from the top to bottom. And the number of the population that are supposed to be on every bar is not there, although its on my localhost, argggggg! Just imagine they are there.Resolved. Thanks to Matt!

inchworms -
Tue 20 August, 2013, 17:00
It’s the 20th of August already. That means we’re already more than half way through our coding summer. As we went through our Sinatra refactoring with coach Matt this morning we realised how far we’d come in the last month and a half. Apart from things being waaaay less confusing, we also seem to know the right questions to ask. Inch by inch we’re making progress :-)
The next step with our data viz project was to try and find someway of mapping zipcodes to geographical administrative regions. We found some useful data files that we were able to download at geonames.org and spent the rest of the day exploring what the files contained and how we would need to handle them, and our existing data files, and mash them into something our visualisations can use.
Also: Adriaan came to visit. He had some tips for how we might set up our database and tables in it.

inchworms -
Mon 19 August, 2013, 17:22
Today we were feeling ambitious. So after finishing refactoring our Sinatra tests, we decided to take our D3 learnings and make some maps of Europe.
First we needed to find the shapefiles for our chosen countries (Carla chose the Czech Republic, Anja went with Germany). We found them on the Global Administrative Areas website.
Then we had to convert our shapefiles into GeoJSON files, a format that D3 can work with. We did this using something called gdal, then running the ogr2ogr command on our downloaded .shp file (details of exactly how to install this software can be found in Interactive Data Visualization on p233).
Once we had this the next challenge was to work out how to properly use the D3 projection function. We didn’t realise it was important to pass latitude and longitude coordinates for where the centre of the map should be (in Anja’s case, 50 and 10, in Carla’s 48 and 15). From there, scaling and colouring the maps was easy as we could use the same code from our previous US example.
CRUCIALLY: We also need to wrap each of our maps in seperate functions:
	(function() {
			*code goes here*
	})()
This helps keep any confusion with variable name conflicts in check.
Here is the Czech Republic, with regions in the tooltips:
But Germany is bigger ;-)

inchworms -
Thu 15 August, 2013, 17:00
We spent half the morning trying to get the printer driver to run and print with Anja’s computer (to print our eurocamp-ticket). Well we didn’t succeed. After what seemed like an hour Carla tried to print from her computer, which usually works but siehe da, the printer was out of color.
Well trolled!
So we don’t have a printed eurocamp ticket but we hope they’ll let us in tomorrow anyway!
Then we went on with the book. Today we proceed with the chapter about geomapping. It gave us some really nice examples of how to draw a map with d3.
Then we draw our first map. Coincidentally the data from the book are reports of agricultural productivity in the USA during the year 2004. Fits perfectly with our next project. This time it took only about half an hour to get the tooltips working, but we didn’t get the coloring working like it should (it works on localhost but not here), grrrrrh!


 Not working json
 working json
