
The Technique of Shoving
Today we continued working with our test data, making decisions about what we wanted to show and the data structure we would need to build. Our first objective was to show a bar chart of the top 20 subsidy recipients by year.
First step: retrieve the relevant data and “shove” it into a ruby hash.
	require 'csv'
	require 'rubygems'
	require 'sequel'
	require 'logger'

	# top_payments will be an aray of hashes with the final results
	# eg [{rank: 1, name: "horst", amount: 234556}, {...}]
	top_payments = []

	# connect to an in-memory database
	DB = Sequel.postgres("farmsubsidy_performance", :loggers => [Logger.new($stdout)])

	#select a year between 2004 and 2011
	p "Select a year between 2004 and 2011:"
	year_selection = gets

	# find the year_id from the years table
	year_id = DB[:years].where(year: year_selection.to_i).first[:id]

	# find payments by year, order them by amount, and return the first 20
	payments_sorted = DB[:payments].where(year_id: year_id).reverse_order(:amount_euro).limit(20)

	# find recipient name, create an index, shove it into top_payments hash
	payments_sorted.each_with_index do |payment, index|
		recipient_name = DB[:recipients].where(id: payment[:recipient_id]).first[:name].gsub("\"", "")
		top_payments << {rank: index+1, name: recipient_name, amount: payment[:amount_euro]}
	end

	p top_payments
Then, use the hash to create a CSV file.
	CSV.open("top_payments.csv", "w", :force_quotes => true) do |csv|
	  i = 0
	  csv << ["rank","name","amount"]
	  while i < top_payments.length
	    csv << [top_payments[i][:rank],top_payments[i][:name],top_payments[i][:amount].to_i]
	    i += 1
	  end
	end
Finally, write some d3 code to parse the csv file and display the data like this:
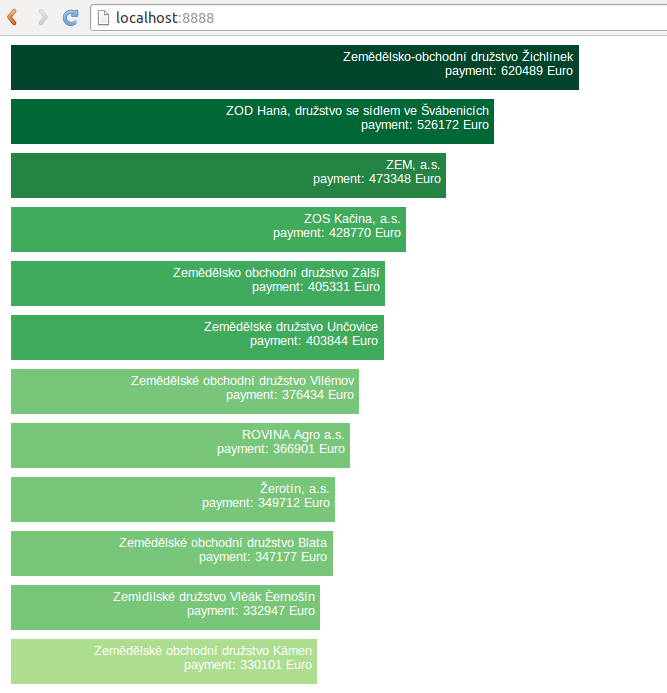
It made us feel like this: