Bar Chart Art
Today was spent reading our D3 primer Interactive Data Vizualisation for the Web. We really like this book, and are finding it an incredibly useful introduction to the javascript framework we’ll most likely be using on our farmsubsidy.org project.
We worked through Chapter 5 and Chapter 6, progressing from generating page elements, to binding data, to drawing divs, to drawing svgs. Anja was, naturlich, very excited at the prospect of playing with different colours. She took the (rather bland) teal of the book’s examples:

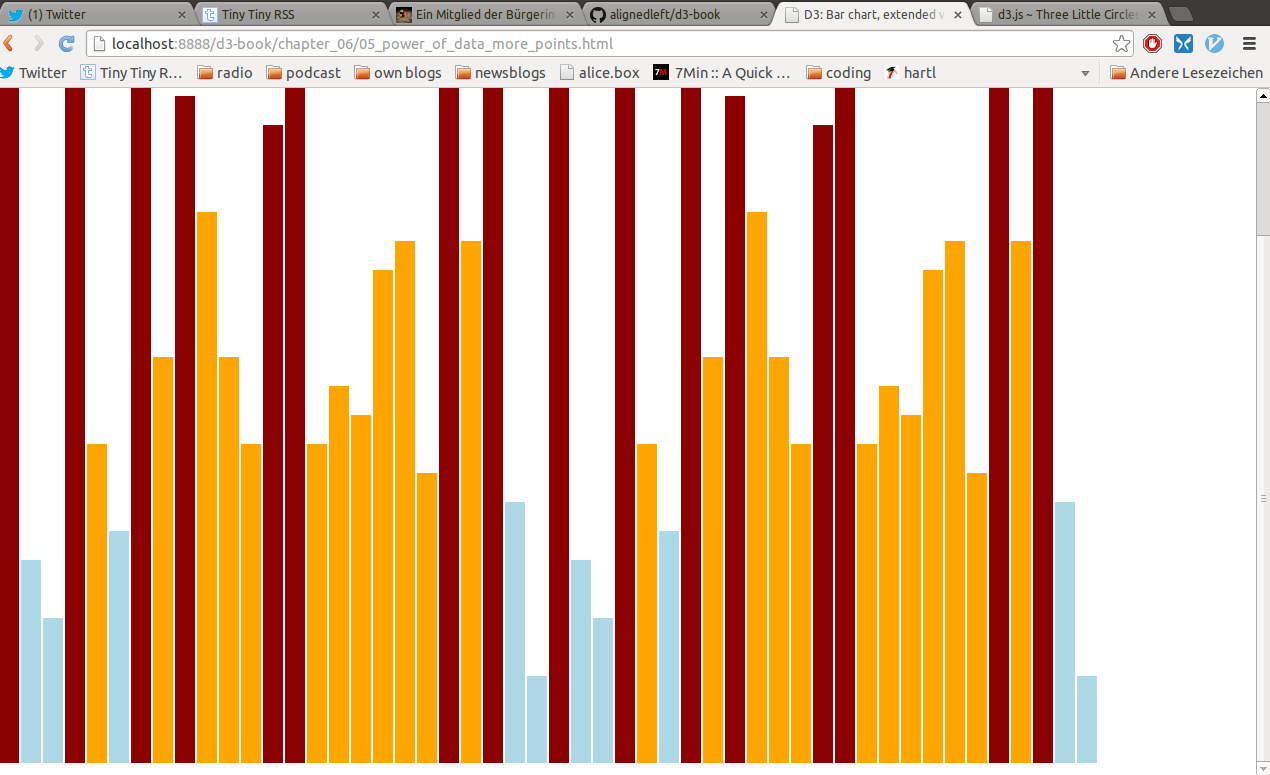
And turned it into a ‘DarkRed’, ‘LightBlue’, ‘Orange’ delight:

(For a list of CSS colour names we referred to the W3C website)
She also made the whole chart taller because she wanted it to fill her entire screen.
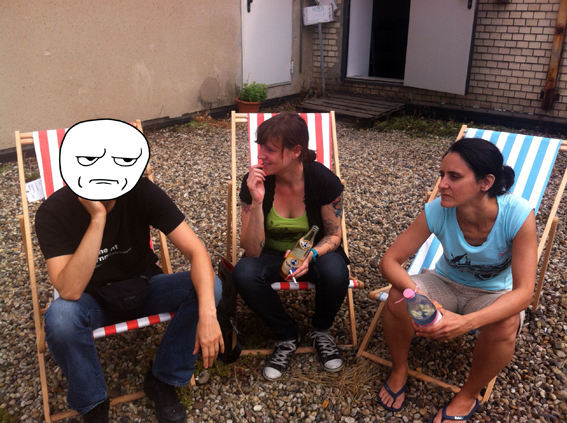
Then @bioshrimp came to visit for lunch. We sat on the roof and tried to look cool. Only @bioshrimp succeeded - no one with tats so good could ever look uncool :-)
(Anja will post a photo here later, once she has redacted her face from the shot...)
Done!


